
Why Training people doesn't Build AI Capability
People, Culture and Sustained Enablement is the lowest-scoring pillar in the entire AI Maturity Index research baseline, at 13%. Lower than strategy....
1 min read
Katie Stow
Updated on February 1, 2017
User Experience (UX) may seem to be all science and tech, numbers and reports, but really we should be looking at user experience from human-centric approach. Yes your site should be optimised and look great and functional on a first impression - we won't argue with you on that one! However, the emotional impact and lasting impression to leave with your users when they visit your site has to be your focus. With inbound marketing we are all about delighting leads, and this is a fool-proof way to keep those leads so happy that they might just keep coming back for more!
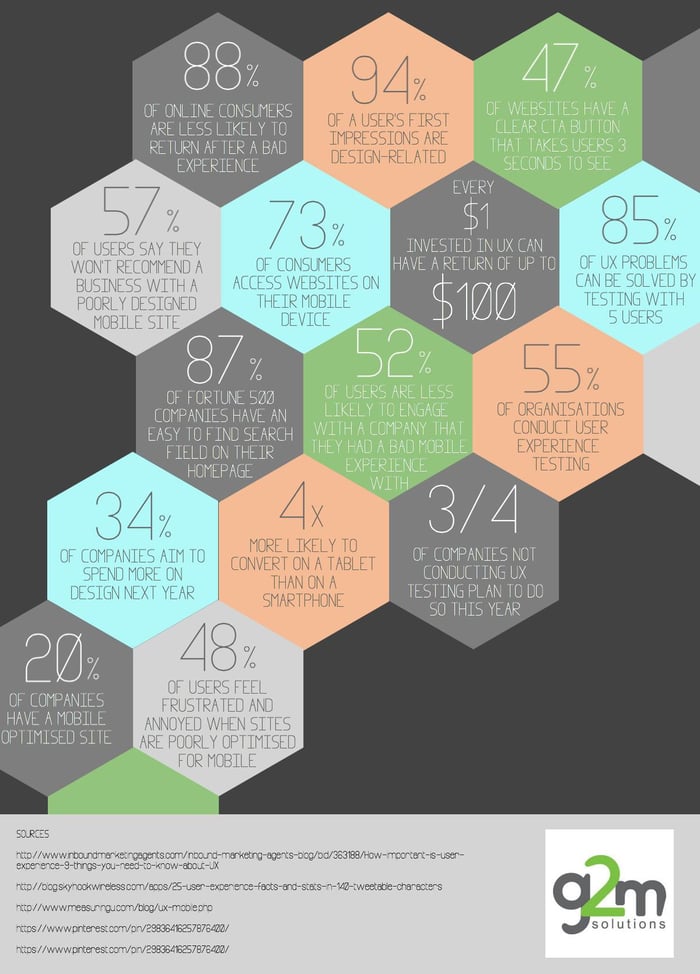
Before you get too excited about diving into the mysterious world of UX, have a read of these essential statistics...


Now you know what you are up against, it's time to delight your leads with a brilliantly designed, user-centric, website experience!
In case you have a hatred for infographs, here are the 13 statistics on user experience typed out just for you:
Want to please your leads even further ? Find out how to guide them through the buyer's journey with a read of our free eBook:
Subscribe to our latest news and updates on HubSpot.
People, Culture and Sustained Enablement is the lowest-scoring pillar in the entire AI Maturity Index research baseline, at 13%. Lower than strategy....

Process Redesign is the second-lowest scoring pillar in the AI Maturity Index research baseline, at 17%. Only people and culture scores lower. And...
Technology Architecture is the highest-scoring pillar in the AI Maturity Index research baseline, at 27%. On the surface, that sounds like good news...